Making rumen health visible, one thermal frame at a time.
Our approach combines optical gas imaging with purpose-built deep learning. We capture the gases cattle emit, teach lightweight networks to find and measure those plumes, and connect plume behavior to subacute ruminal acidosis — all in real time.
Three complementary data sources
We build from the controlled to the chaotic — establishing ground truth in the lab, then proving the system on live animals.
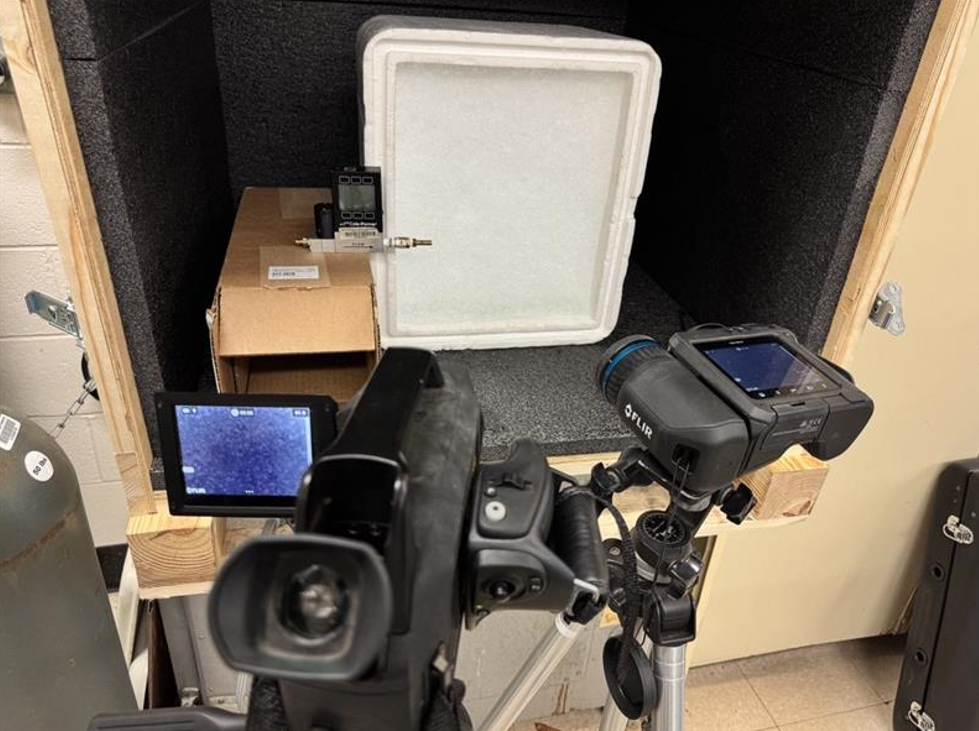
A calibrated gas chamber
Known volumes of CO₂ are released into an insulated chamber and recorded with FLIR optical gas imaging cameras. Because every release is measured, each frame carries a precise, trustworthy label — the foundation for supervised plume segmentation.
This controlled corpus lets the models learn what a gas plume looks like thermally before they ever face a noisy barn.
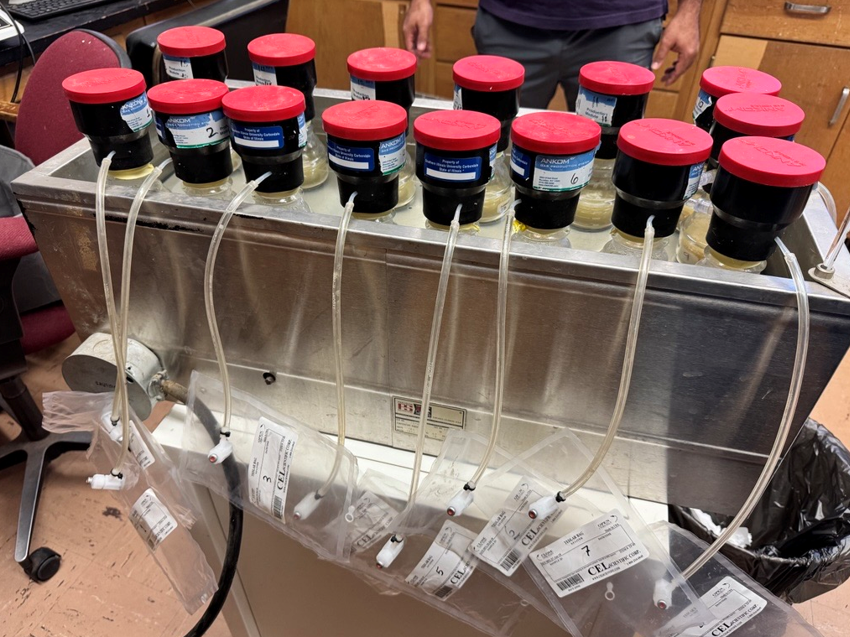
Recreating the rumen in a bottle
Using ANKOM gas-production arrays, we simulate rumen fermentation under controlled diet and pH conditions — including those that drive acidosis. The systems measure gas output directly, tying the chemistry of fermentation to the gas signatures our cameras observe.
This bridges the gap between what a camera sees and what is actually happening inside the rumen.
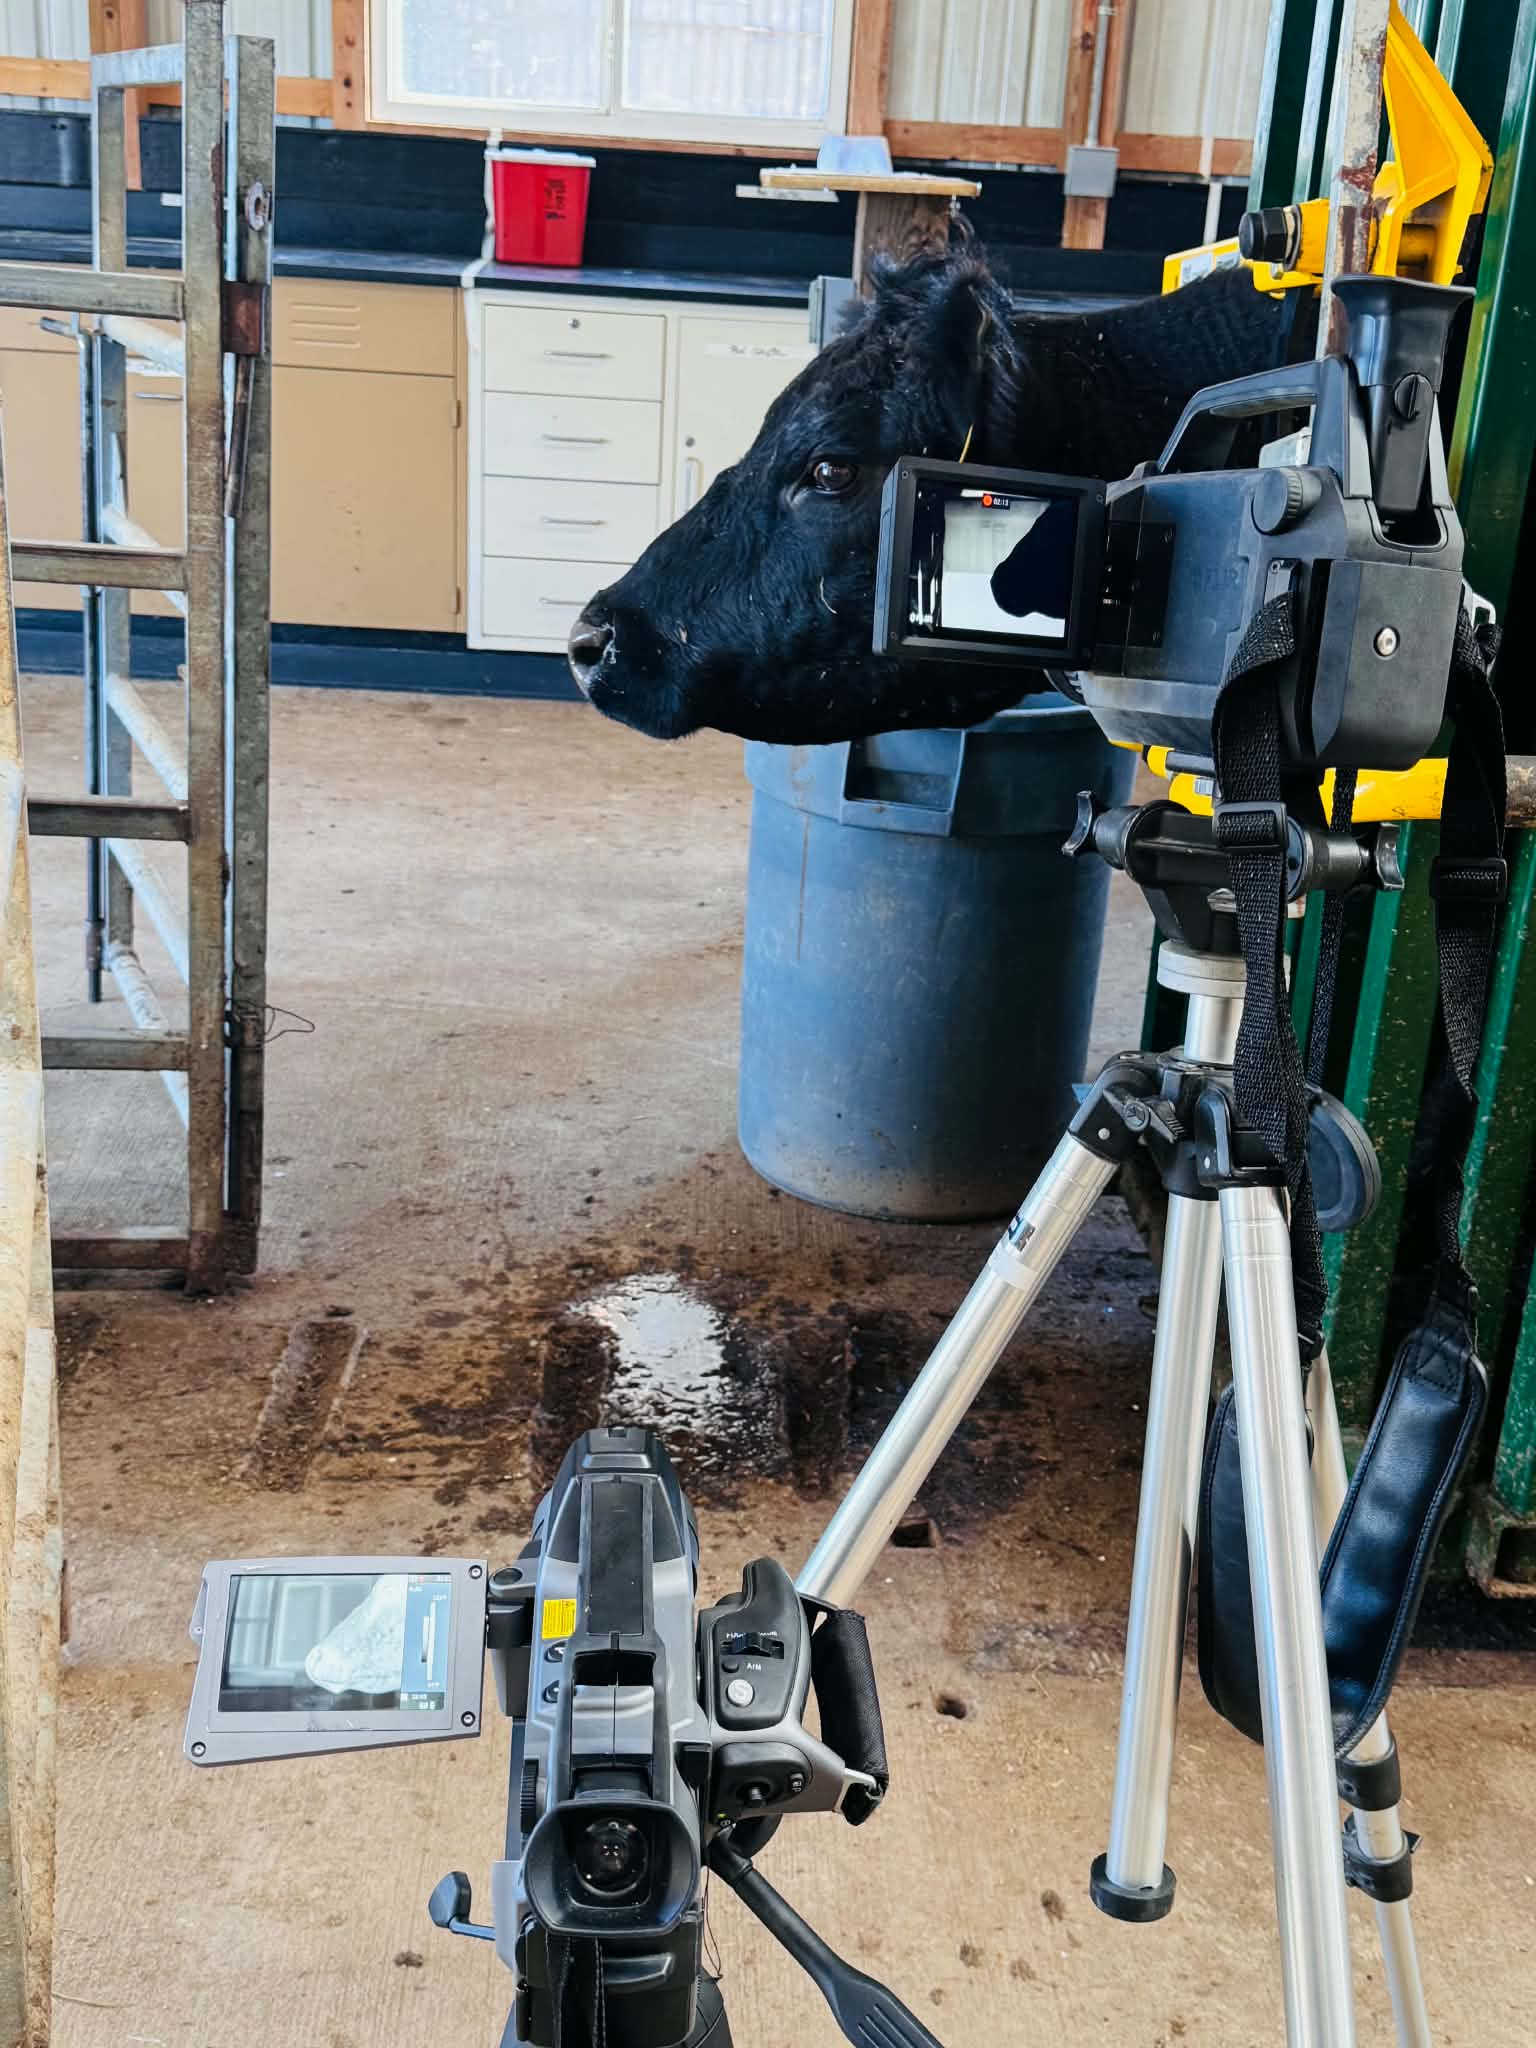
Live cattle, real conditions
Finally, dual OGI cameras record cattle at the SIU farm. Models pre-trained on controlled data are fine-tuned on these real recordings — adapting to the motion, clutter, and thermal variability of an actual barn.
It is here that the system has to earn its accuracy, and where it ultimately delivers.
The detection pipeline
OGI thermal video
Cameras render CO₂ and methane as visible plumes.
Plume isolation
Lightweight networks mask the plume pixel-by-pixel.
Emission metrics
Plume area and dynamics become fermentation proxies.
SARA risk
Vision-language models flag acidosis risk.
A system that grew across three papers
CarboFormer
A lightweight semantic segmentation architecture purpose-built for CO₂ detection in optical gas imaging. CarboFormer pairs strong accuracy with a small footprint — pre-trained on controlled CO₂ release data and fine-tuned on real cattle recordings — so it can run in real time on edge hardware.
FUME
FUME extends the system from one gas to many. A fused, unified network jointly segments CO₂ and methane plumes from livestock rumen emissions — recognizing that the two gases together tell a richer story about fermentation and animal health than either alone.
VLMDual
The most recent step closes the loop from perception to diagnosis. VLMDual is a vision-language distillation framework that jointly performs classification and plume segmentation — distilling the knowledge of large vision-language models into an efficient network that can both see the plume and judge acidosis risk.
CarboFormer vs. the field
Semantic segmentation performance, pre-trained on controlled CO₂ release and fine-tuned on real cattle data. Best result in each column in maroon.
FUME vs. the field
Joint CO₂ + methane segmentation, evaluated against efficient and OGI-specific models. Metrics are averaged across both gas modalities (three classes each). The FUME row is highlighted.
This work is supported by the United States Department of Agriculture, National Institute of Food and Agriculture (USDA-NIFA), through the Capacity Building Grants for Non-Land-Grant Colleges of Agriculture.